We’ve provided some maps of our restoration and monitoring activities in the watershed to help you get an idea of the scope and breadth of our work. Click on a thumbnail below to open a slideshow and get a watershed-wide view of where and what we’re doing. If you have Google Earth on your computer, please feel free to download these layers and view them in Google Earth. Here’s what we’d like you to understand.
- Council Projects – In the past 15 years, we’ve completed or started work on over 60 restoration projects! This map will show you where we’ve done restoration work. For information on specific restoration projects, please see or Restoration Projects List page. We concentrate our efforts in areas where there is the greatest need and where we can have the greatest impact to improve stream health and habitat for fish and wildlife. Data from these other maps helps us prioritize areas to target for restoration.
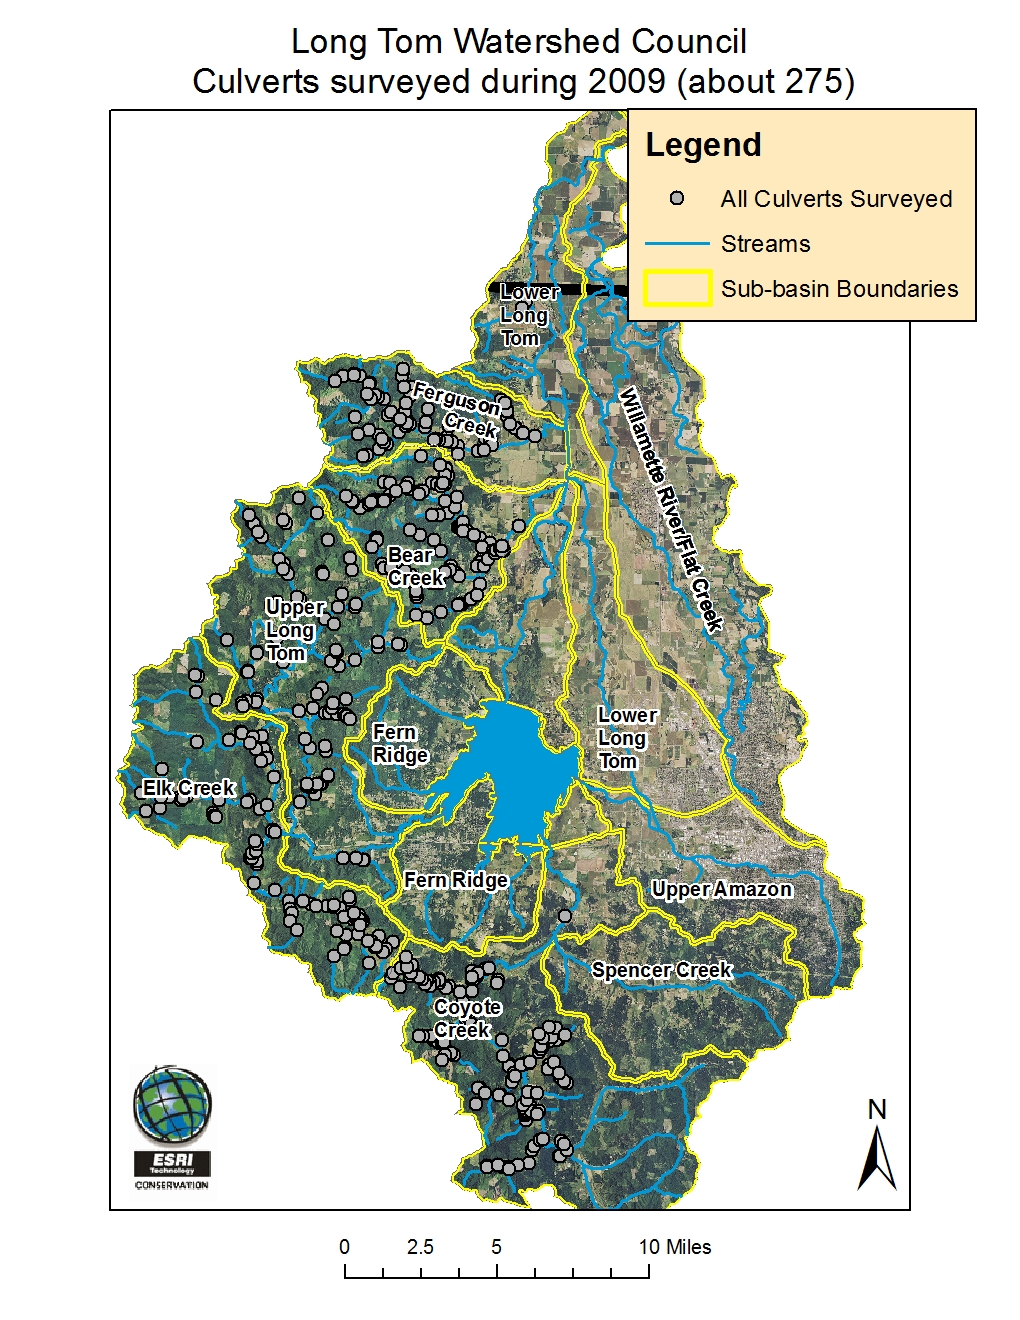
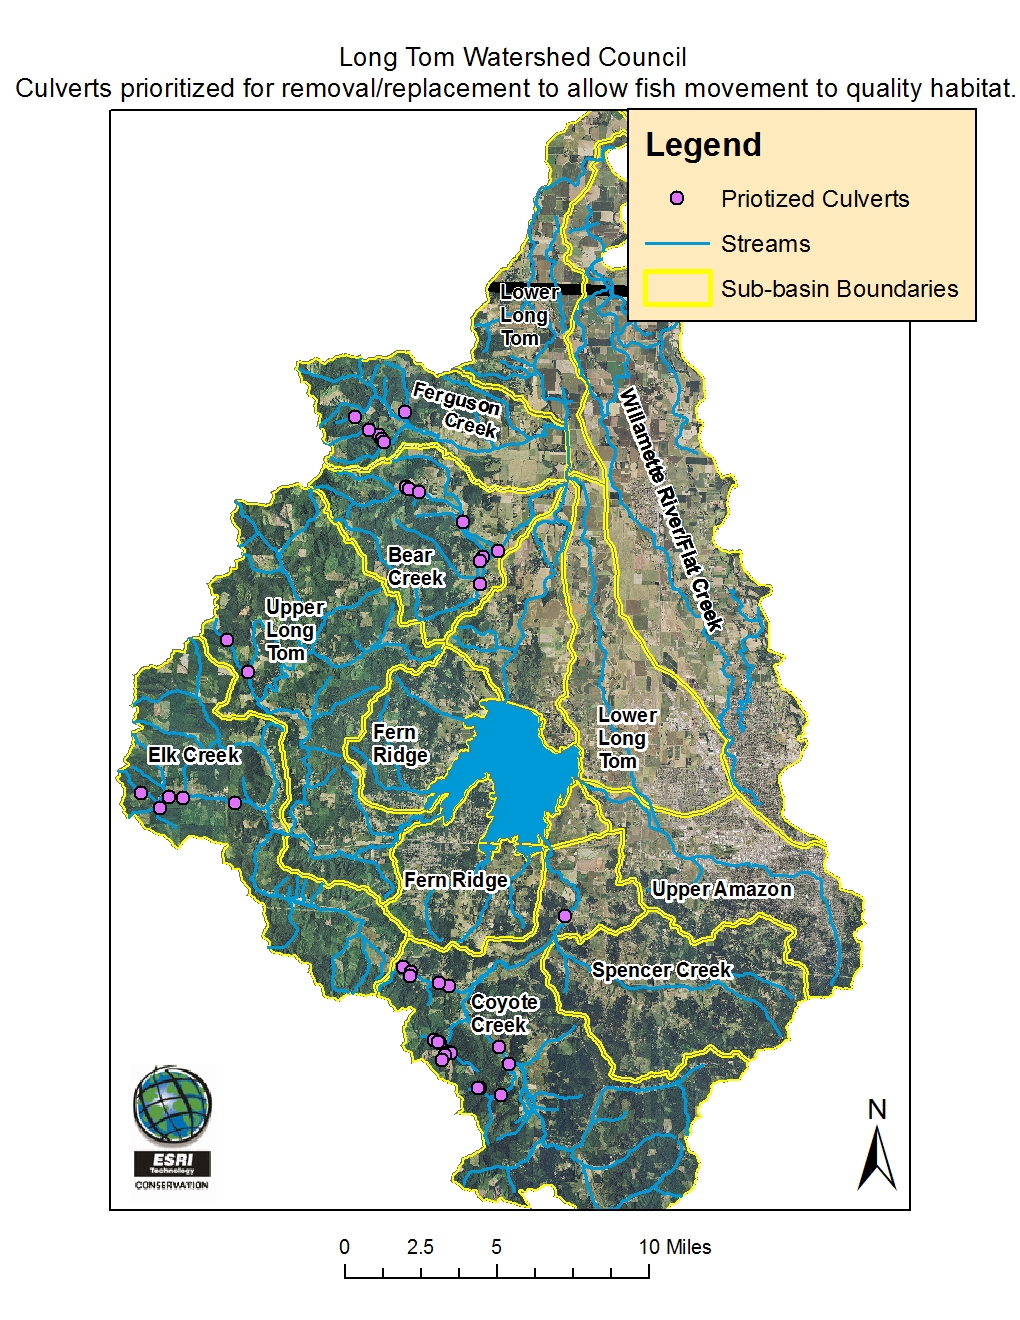
- Culverts Surveyed during 2009 – During summer 2009, LTWC surveyed over 275 culverts in the watershed and found that about 80% impeded or blocked fish movement. Those are a lot of culverts to replace, so we prioritized which culverts prevented native fish such as cutthroat trout from reaching the best habitat for spawning, rearing juvenile fish, and escaping warmer water in the summer. The Prioritized Culverts map shows which surveyed culverts have been prioritized for replacement or removal.
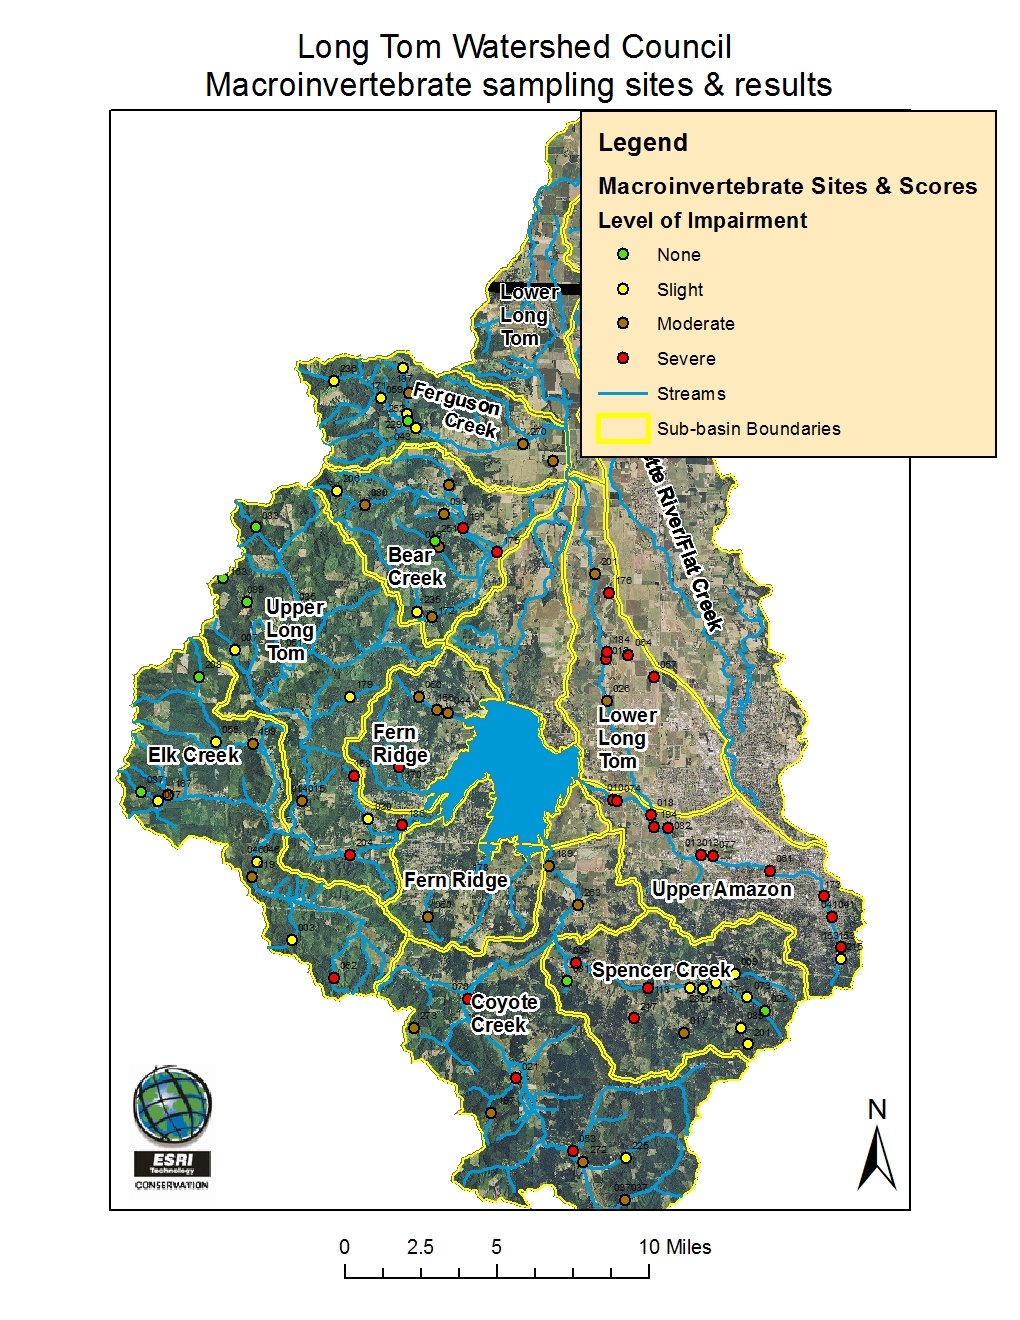
- Macroinveretebrate Sampling Sites & Results – Macroinvertebrates are aquatic species such as insects, crayfish, mussels, snails, and worms. These animals are good indicators of stream health. When stream health is impaired, there will generally be fewer macroinvertebrates present. This map shows where we collected samples and the level of stream health based on macroinvetebrate presence.
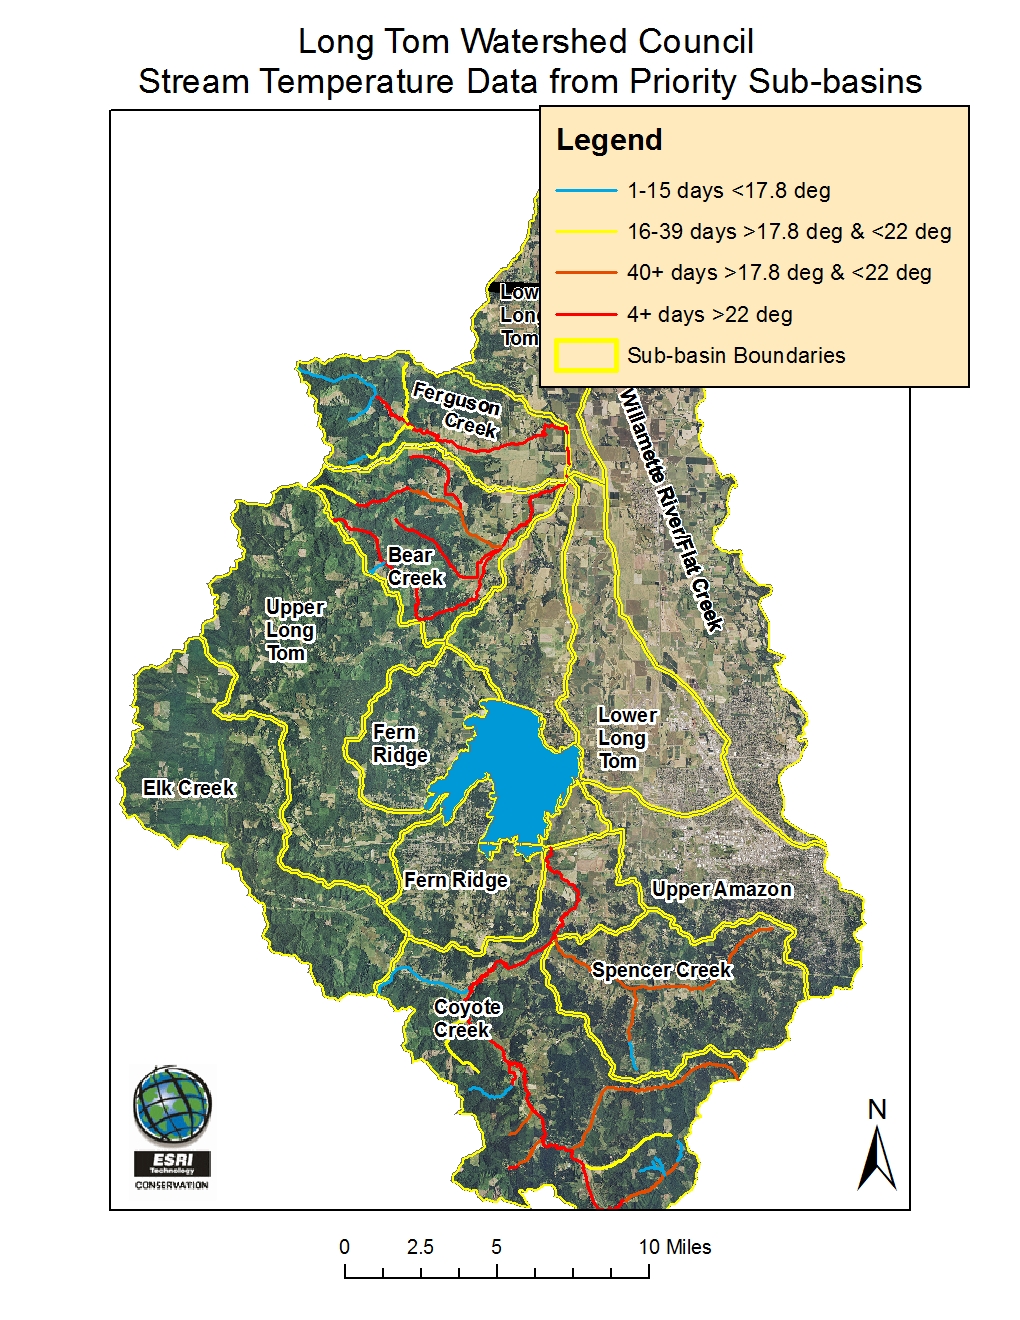
- Stream Temperature – Warm water temperatures stress and potentially kill native fish like cutthroat trout and other aquatic animals. We’ve been collected water temperature data since 1999, and this map shows data from stream segments in the three sub-basins we’re currently targeting for improving water temperature: Bear, Ferguson, and Coyote Creeks.